
サンプルスクリプト
[2-1] 制御の定常解析 【Control_Steady.pde】
1. 概要
このサンプルは、制御アプリケーションで GLOBAL VARIABLE の使用例を示します。
領域上に結果として生じる平均温度が指定した数値(700°)になるように、ヒーターに必要な入力電力を見つけます。
公称電力を定めている方程式が、明白には電力変数に言及しませんが、温度方程式で加熱期間を通して結合することに注意して下さい。
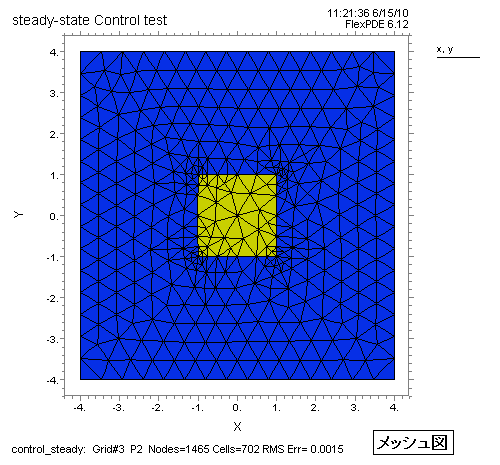
2. メッシュ図
青色部分 :熱伝導率 k=0.1
黄色部分(ヒーター):熱伝導率 k=50
青色メッシュの外周境界は、325°一定です。
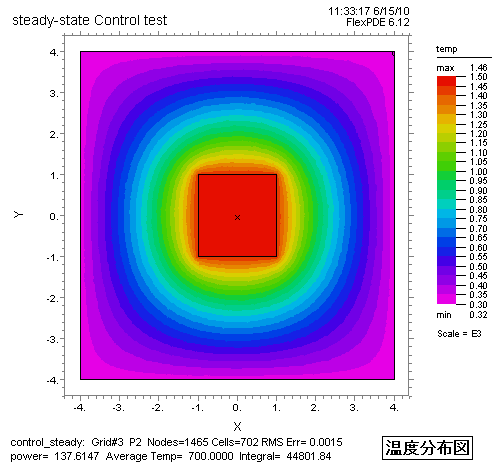
3. 解析結果
温度分布図の下段タイトル部に、平均温度 Average Temp= 700.0、及び入力電力
power=137.6 と表示されます。
積分値 Integral=44801.8 を解析領域の面積 8x8=64
で割った値が、平均温度 700.0 と一致します。
{Fig.A} は、4項で対応するスクリプトを示します。
温度分布図:{Fig.A}
4. スクリプト
下記のスクリプトをマウスでコピーし、FlexPDE エディット・ウィンドウに貼り付けて実行する際には、日本語のコメントを除去して下さい。そのままですと、コンパイル・エラーが発生する場合があります。
{  CONTROL_STEADY.PDE

    This example shows the use of a GLOBAL VARIABLE in a control application.
    We wish to find the required power input to a heater, such that the resulting
    average temperature over the domain is a specified value.

    Notice that the equation nominally defining power does not explicitly reference
    the power variable, but is coupled through the heat term in the temperature
    equation.
}

TITLE "steady-state Control test"

VARIABLES
  temp      { The temperature field }

GLOBAL VARIABLES
  power     { a single value for input power }

DEFINITIONS
  setpoint=700      { the desired average temperature 目的とする平均温度}
  skintemp=325      { fixed outer boundary temperature 一定外周温度}
  k=1               { conductivity 熱伝導率}
  heat=0            { the heat function for the temperature.
                      it is non-zero only in the heater region }

  tcontrol=integral(temp)/integral(1)   { the control function, average temperature }
{  tcontrol=val(temp,0,0)     -- an alternative control method, unused here }

INITIAL VALUES
  temp = setpoint
  power= 100        { initial guess for power 電力の初期推定値}

EQUATIONS
  temp:   div(-k*grad(temp))-heat = 0   { diffusion of temperature field 温度の拡散}
  power:  tcontrol = setpoint           { single equation defining power }

BOUNDARIES

  REGION 'Insulation'
    k=0.1
    heat=0
    start(-4,-4)
      value(temp)=skintemp
    line to (4,-4) to (4,4) to (-4,4) to close

  REGION 'Heater'
    k=50
    heat=power
    start(-1,-1) line to (1,-1) to (1,1) to (-1,1) to close

MONITORS
  contour(temp)
    report power
    report tcontrol

PLOTS
  grid(x, y)
  contour(temp) painted
    report power
    report tcontrol as "Average Temp"		{Fig.A}
  elevation(temp) from(-4,0)  to (4,0)
  elevation(temp) from(-4,-4) to (4,4)

END