
サンプルスクリプト
[4-1] 3D箱内の流れ解析 【3D_Flowbox.pde】
1. 概要
この問題は、3D流体でのFlexPDEの使用例を示します。
それは、底面・上面にそれぞれ円形に突き出した流入口・出口を持ち、流体で満たされた箱内の流れを示します。
流入圧は 0.05
で、単位とともに任意に設定できます。
問題は2つのステージで解析します。最初に線形システムで、質量なしの流体として初期状態圧力と速度分布を求めて、それから慣性項を含めます。
最適メッシュ細分化は、本サンプルでは解析時間短縮のためオフにします。ご使用のパソコンの性能や、解析実行時のCPU負荷によりますが、最適メッシュ細分化オフで解析実行に約8分かかりました。
実際の問題では、ダクトの角を通過する流れをよりよく解析するのに、最適メッシュ細分化を用いることができます。
解法には『Penalty pressure』を使います。そこにおいて、圧力変数は単に質量保存を保証するだけです。
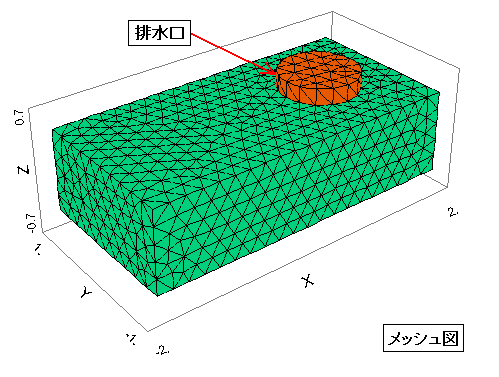
2. メッシュ図
下図に示しますメッシュ図では、底面の円形に突き出した流入口が隠れて見えていません。
箱の表面(6面)全てにおいて、流速,圧力とも 0 で固定です。
流体の粘度:0.01
流入圧 :0.05
出口圧 :0
Penalty = 1e4*流体の粘度/箱高さの半分^2
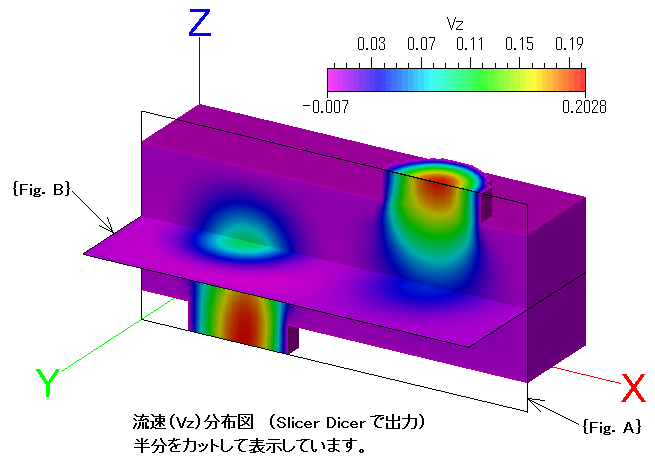
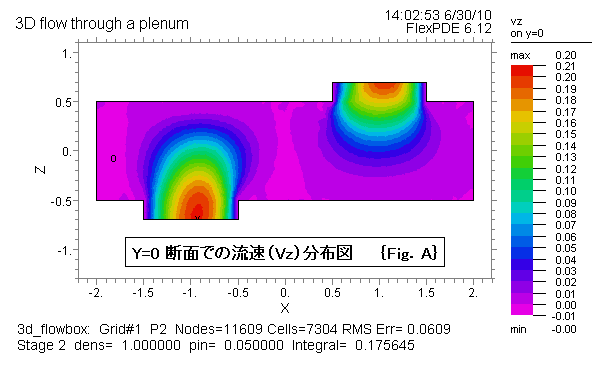
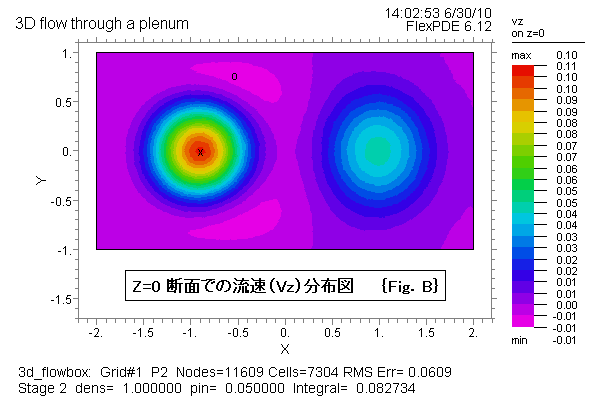
3. 解析結果
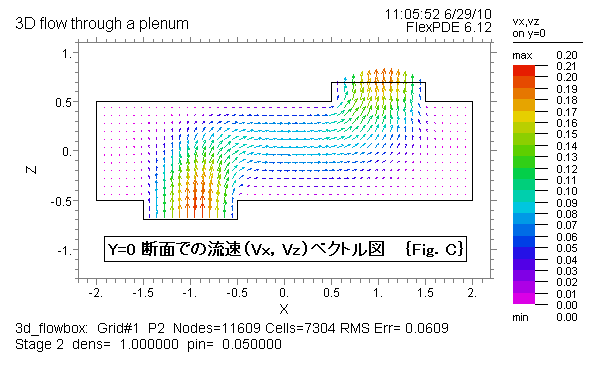
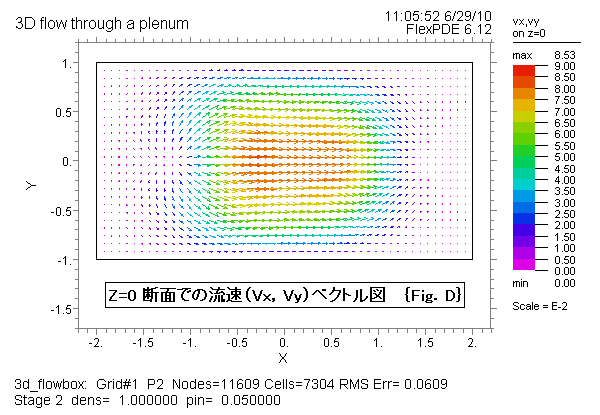
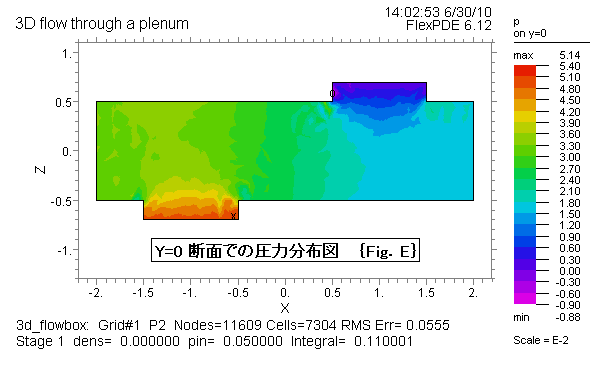
流速 (Vz) 分布図、流れ (Vx, Vy, Vz) ベクトル図、及び圧力分布図を示します。
図中の {Fig. A}、{Fig. B} は、それぞれの図と対応し、更に4項で対応するスクリプトを示します。
{Fig. C}、・・・、{Fig. E} も同様です。
4. スクリプト
下記のスクリプトをマウスでコピーし、FlexPDEエディット・ウィンドウに貼り付けて実行する際は、日本語のコメントを除去して下さい。そのままですと、コンパイル・エラーが発生する場合があります。
{  3D_FLOWBOX.PDE

  This problem demonstrates the use of FlexPDE in 3D fluid flow.  It shows the flow of fluid
  through a plenum box with a circular inlet at the bottom and an offset circular outlet at the top.
  The inlet pressure is arbitrarily set at 0.05 units.

  The problem runs in two stages, first as a massless fluid to get an initial pressure and velocity
  distribution in a linear system, and then with momentum terms included.

  Adaptive mesh refinement is turned off for speed in demonstration.
  In a real application, regridding could be used to better resolve the flow past the corners of the ducts.

  The solution uses a "penalty pressure", in which the pressure variable is used merely to guarantee
  mass conservation.
}

title '3D flow through a plenum'

coordinates
  cartesian3

variables
  vx(1e-6)	vy(1e-6)	vz(1e-6)	p

select
  ngrid=20
  stages=2
  regrid=off		{ 最適メッシュ細分化オフ }

definitions
  long = 2
  wide = 1
  high = 1/2
  xin = -1   yin = 0
  xout = 1   yout = 0
  rc = 0.5
  duct = 0.2

  dens=staged(0,1)  { fluid density  流体の密度 }
  visc= 0.01        { fluid viscosity 流体の粘度 }
  v=vector(vx,vy,vz)
  vm=magnitude(v)

  div_v = dx(vx) + dy(vy) + dz(vz)

  Penalty = 1e4*visc/high^2

  Pin = 0.05
  Pout = 0

initial values
  vx=0
  vy=0
  vz=0
  p=Pin+(Pout-Pin)*(z+high+duct)/(2*high+2*duct)

equations
  vx:   dens*(vx*dx(vx) + vy*dy(vx) + vz*dz(vx)) + dx(p) -visc*div(grad(vx)) = 0
  vy:   dens*(vx*dx(vy) + vy*dy(vy) + vz*dz(vy)) + dy(p) -visc*div(grad(vy)) = 0
  vz:   dens*(vx*dx(vz) + vy*dy(vz) + vz*dz(vz)) + dz(p) -visc*div(grad(vz)) = 0
  p:    div(grad(p)) = Penalty*div_v

extrusion z = -high-duct,-high,high,high+duct

boundaries

    Region 1    { plenum box }
       surface 2 value(vx)=0  value(vy)=0  value(vz)=0 natural(p)=0
       surface 3 value(vx)=0  value(vy)=0  value(vz)=0 natural(p)=0
       layer 1 void
       layer 3 void
       start(-long,-wide)
            value(vx)=0  value(vy)=0  value(vz)=0 natural(p)=0  { fix all side values 箱の側面 }
         line to (long,-wide)
           to (long,wide)
           to (-long,wide)
           to close

    limited Region 2    { input hole 流入口 }
      layer 1
      surface 1 natural(vx)=0  natural(vy)=0  natural(vz)=0 value(p)=Pin    { input duct opening 流入口開口部
 }
      start(xin,yin-rc)
            layer 1   value(vx)=0  value(vy)=0  value(vz)=0 natural(p)=0    { duct sidewall drag ダクト外周面 }
        arc(center=xin,yin) angle=360

    limited Region 3    { exit hole 出口 }
      layer 3
      surface 4 natural(vx)=0  natural(vy)=0  natural(vz)=0 value(p)=Pout   { output duct opening 出口開口部
 }
      start(xout,yout-rc)
            layer 3   value(vx)=0  value(vy)=0  value(vz)=0 natural(p)=0    { duct sidewall drag  ダクト外周面 }
        arc(center=xout,yout) angle=360

monitors
    contour(vx)  on x=0 report dens report pin
    contour(vx)  on y=0 report dens report pin
    contour(vz)  on y=0 report dens report pin
    vector(vx,vz)on y=0 report dens report pin
    contour(vx)  on z=0 report dens report pin
    contour(vy)  on z=0 report dens report pin
    contour(vz)  on z=0 report dens report pin
    vector(vx,vy)on z=0 report dens report pin
    contour(p)   on y=0 report dens report pin

plots
    contour(vx)  on x=0	painted	report dens report pin
    contour(vx)  on y=0	painted	report dens report pin
    contour(vz)  on y=0	painted	report dens report pin		{ Fig. A }
    vector(vx,vz)on y=0 report dens report pin			{ Fig. C }
    contour(vx)  on z=0	painted	report dens report pin
    contour(vy)  on z=0	painted	painted	report dens report pin
    contour(vz)  on z=0	painted	report dens report pin		{ Fig. B }
    vector(vx,vy)on z=0 report dens report pin			{ Fig. D }
    contour(p)   on y=0	painted	report dens report pin		{ Fig. E }

end